
Guide section
Reports
Reports overview
Summary charts, filters, and the four report tabs — Summary, Cash flow, Goals, and Bills.
The Reports tab turns your entries into charts and breakdowns. Use it to understand patterns, check budgets, plan cash flow, and see upcoming bills.
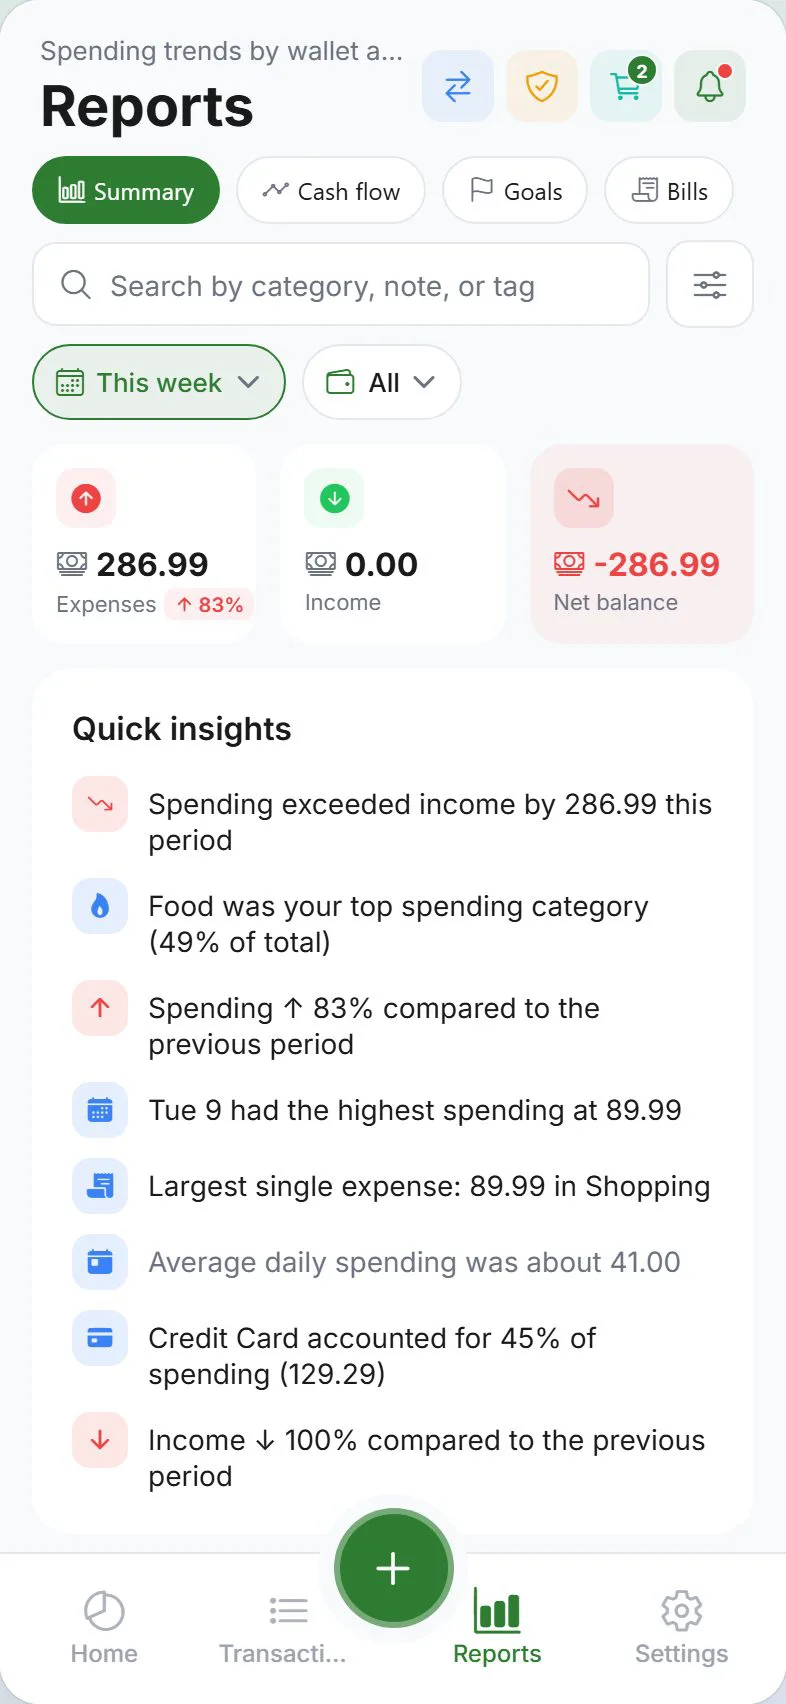
Open Reports
Tap Reports in the bottom tab bar.
Four report tabs
At the top of Reports, switch between:
| Tab | What it shows | Guide |
|---|---|---|
| Summary | Spending overview, insights, budgets, category and method breakdowns, charts | This page (below) |
| Cash flow | Money in vs out over months or years | Cash flow report |
| Goals | Savings contributions and goal stats | Goals report |
| Bills | Upcoming scheduled bills (14-day view) | Bill calendar |
Summary tab — in detail
Period filter
Same options as the Dashboard: Today, This week, This month, Custom range, All time, etc.
Wallet and tag filters
When you have multiple wallets or tags, use filter chips at the top to narrow the report. Combine wallet + tag for precise views — for example, “Credit card” wallet + “vacation” tag.
What you will see
- Net balance for the period
- Quick insights — highlights about spending patterns
- Budget utilization — how much of each budget you used
- By category — pie or bar breakdown
- By payment method — where spending left from
- Over time charts — daily, weekly, or monthly trends depending on period length
Stealth mode
With stealth mode on, chart totals are masked. Press and hold to peek.
Cash flow tab
Long-range income vs expense trends — 3, 6, or 12 months, or up to 5 years. Includes a What-if planner to estimate savings if you trim top categories.
Requires cloud sync and an internet connection for full data. See Cash flow report.
Goals tab
Contribution totals and per-goal statistics for the selected period. Requires signed-in account with savings goals. See Goals report.
Bills tab
Same view as the Bill calendar — upcoming scheduled entries for the next two weeks. See Bills calendar.
How reports calculate numbers
Reports run on data stored on your device. Cloud sync brings entries from other devices, then reports use the merged local copy — the math is always from what is on the phone or browser you are using.
Performance
Very long histories (years of daily entries) may take a moment to load. Narrow the period or wallet filter if charts feel slow.
Web vs phone
| Platform | Notes |
|---|---|
| Phone | Swipe charts horizontally where needed |
| Web | Mouse wheel may scroll wide chart areas; more columns visible on wide screens |
Export for spreadsheets
For tax prep or custom analysis, export JSON or CSV from Settings → Data and open in Excel, Google Sheets, or similar.
Tips
| Goal | Where to look |
|---|---|
| Top spending category | Summary → category breakdown |
| Am I over budget? | Summary → budget utilization |
| Can I afford next month? | Cash flow tab — try the What-if card |
| What bills are due? | Bills tab |
| Vacation spending only | Summary + tag filter “vacation” |
Related guides
Was this guide helpful?