
Guide section
Reports
Cash flow report
See money coming in and going out over months or years, plus What-if savings scenarios.
The Cash flow report shows whether you are ahead or behind over time — useful for planning big purchases or checking if income covers expenses month after month.
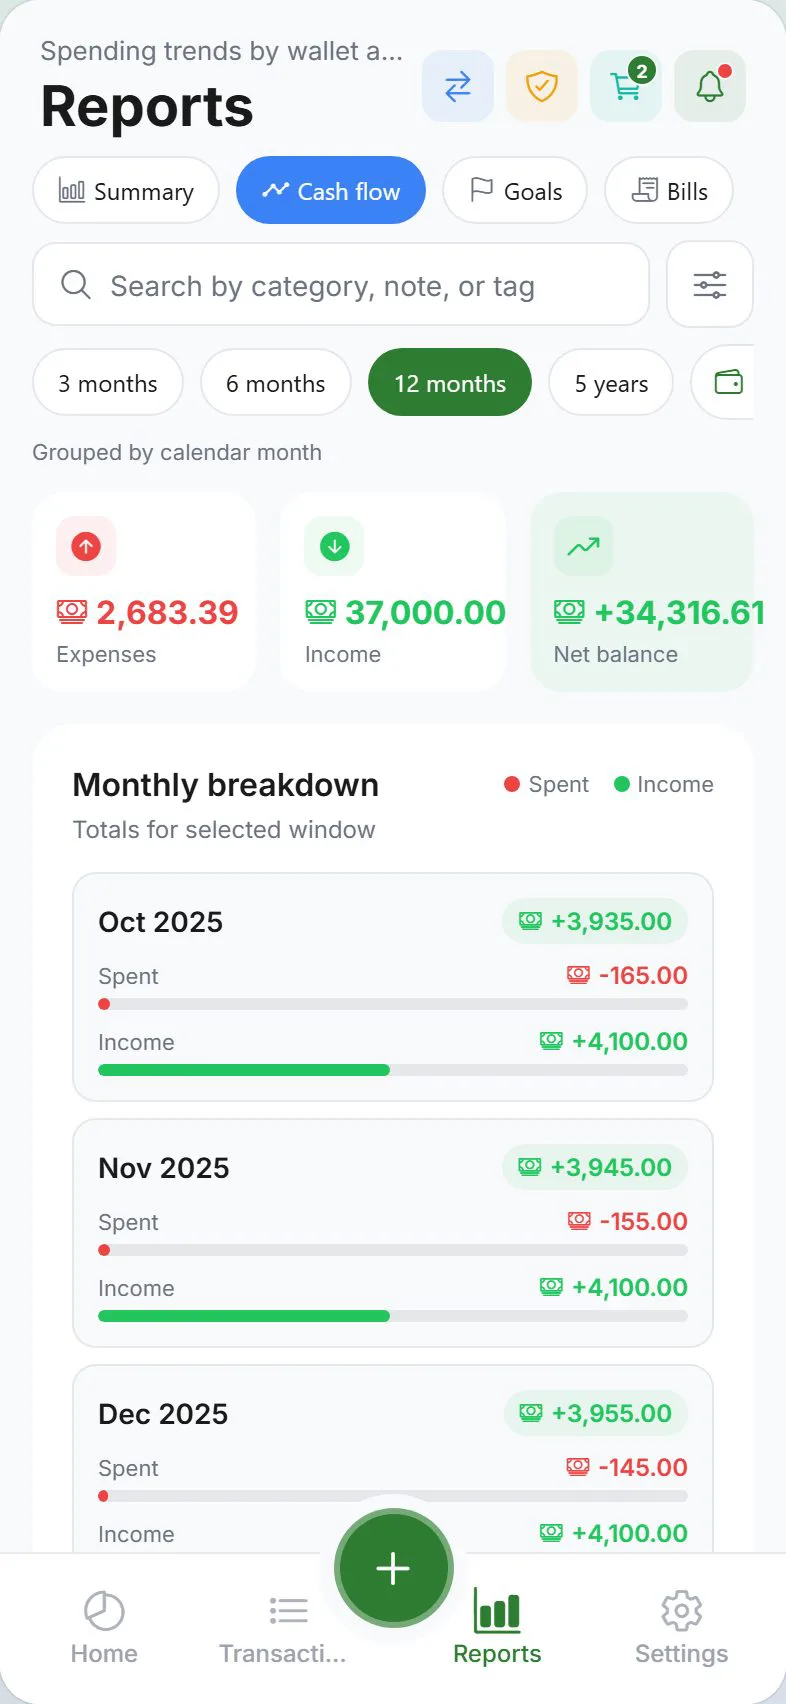
Open cash flow
- Tap Reports
- Select the Cash flow tab at the top
Requirements
| Requirement | Why |
|---|---|
| Signed in | Long-range history uses cloud-backed data |
| Cloud sync on | Keeps devices aligned |
| Internet | May need connection to load full range |
If cash flow is unavailable, the app shows a message — enable sync under Settings → Account and try again.
Choose a time range
Pick how far back to look:
- 3 months
- 6 months
- 12 months
- 5 years (long-term view)
Switch between monthly and yearly grouping when offered — monthly for recent detail, yearly for long trends.
What the chart shows
Typically you will see:
- Money in — income entries per period
- Money out — expenses per period
- Net — difference between in and out
Bars or lines make it easy to spot heavy spending months or income gaps.
Transfers to savings goals (goal contributions) are not counted as everyday spending in cash flow or the category flow diagram — they move money into a goal, not out of your budget as consumption. Track them under Reports → Goals or Transactions → Goals.
Category flow (Sankey)
When enough data exists for the selected range, a category flow diagram shows how money moves from income into spending categories. On small screens you can expand it; a table fallback lists the same flows if the chart is collapsed.
What-if scenarios
Below the chart, the What-if card lets you explore simple “what if I spent less?” ideas — without changing your real entries.
- The app shows your top spending categories with a monthly average
- Tap 10%, 20%, or 30% next to a category to simulate cutting that slice of spending
- See estimated monthly savings update as you pick categories
- If you have an active savings goal, the card may show how many weeks sooner you could reach it
This is a planning tool only — your ledger stays unchanged until you actually spend less or log different entries.
Tap View goals to open the full goals screen, or Clear selections to reset the scenario.
Filters
Use wallet and tag chips (when available) to focus on one account or project — for example, only business-tagged entries.
Stealth mode
Masked totals follow stealth mode — hold to peek.
How to use this report
| Question | What to do |
|---|---|
| “Do I spend more than I earn?” | Look at net line over 12 months |
| “Was December unusually high?” | Compare monthly bars |
| “Side hustle income trend?” | Filter by income tag or wallet |
Related guides
Was this guide helpful?